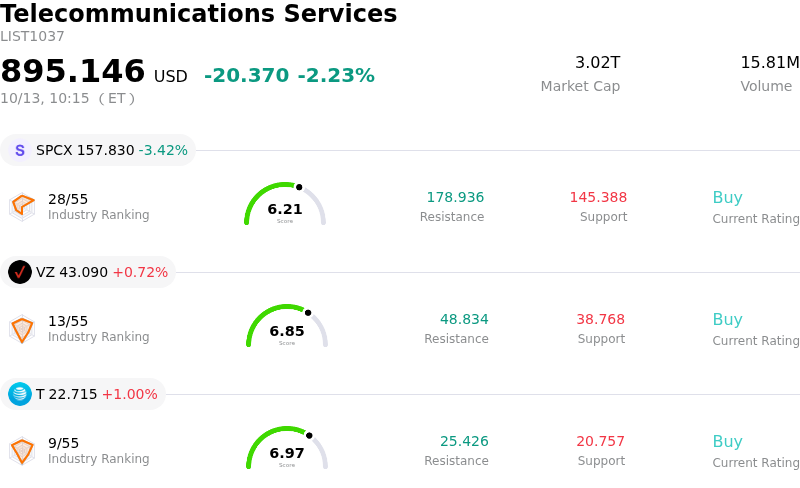
SpaceX (SPCX) moved down by 3.43%. The Telecommunications Services sector is down by 2.23%. The company underperformed the industry. Top 3 stocks by turnover in the sector: SpaceX (SPCX) down 3.43%; Verizon Communications Inc (VZ) up 0.72%; AT&T Inc (T) up 1.00%.
What is driving SpaceX (SPCX)’s stock price down today?
Space Exploration Technologies Corp. experienced downside pressure and elevated intraday volatility as investors engaged in profit-taking following a multi-day rally. The stock had previously surged on major strategic corporate announcements, pushing shares near technical resistance levels where short-term traders chose to lock in gains. This downward move reflects price consolidation as market participants re-evaluate valuation levels following rapid capital appreciation.
A major driver behind the volatile trading session stems from investor recalibration regarding the company's aggressive capital expenditures. While recent developments highlighted major expansion initiatives—including an estimated multi-billion-dollar acquisition of low-band wireless spectrum to scale direct-to-device mobile services and massive capital commitments for artificial intelligence compute infrastructure—these projects emphasize high capital intensity. Although these investments solidify long-term expansion across broadband telecom and enterprise computing, heavy ongoing spending continues to weigh on free cash flow metrics, sparking near-term caution among risk-averse investors.
From an institutional perspective, Wall Street coverage remains broadly constructiveness, backed by recent price target upgrades and positive analyst ratings highlighting long-term top-line momentum in commercial launch and satellite connectivity. However, because the stock carries a premium price-to-sales valuation reflecting high future growth expectations, short-term trading dynamics remain susceptible to sharp intraday swings whenever macroeconomic sentiment shifts or profit-taking pressures emerge.
Technical Analysis of SpaceX (SPCX)
Technically, SpaceX (SPCX) shows a MACD (12,26,9) value of 0.275, indicating a buy signal. The RSI at 53.111 suggests neutral condition and the Williams %R at 60.303 suggests sell condition. Please monitor closely.
Fundamental Analysis of SpaceX (SPCX)
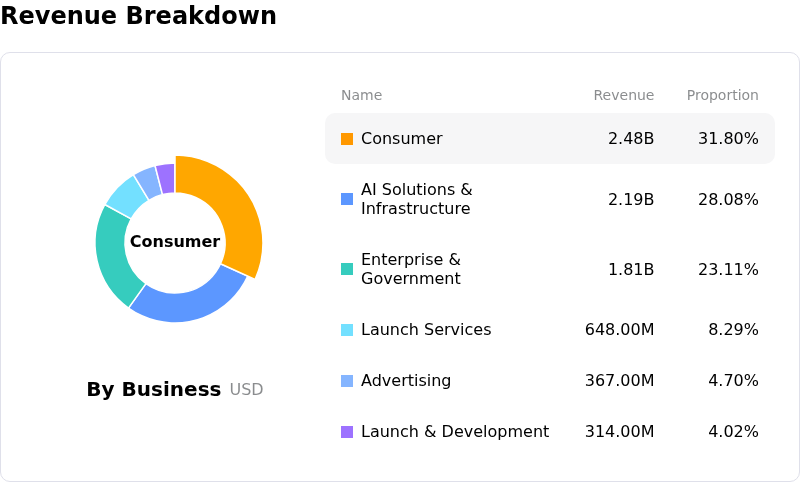
SpaceX (SPCX) is in the Telecommunications Services industry. Its latest annual revenue is $18.67B, ranking 10 in the industry. The net profit is $-4.94B, ranking 61 in the industry. Company Profile
Over the past month, multiple analysts have rated the company as Buy, with an average price target of $213.38, a high of $450.00, and a low of $100.00.
More details about SpaceX (SPCX)
Company Specific Risks:
- Substantial Debt Expansion for AI Capex: SpaceX's plan to issue up to $40 billion in new corporate debt and bank loans to fund massive Nvidia GPU procurement places significant debt-service burdens on the balance sheet, as borrowing approaches nearly 90% of expected annual revenues.
- Intense Cash Burn from Grok Compute Buildout: Rapidly expanding hardware deployment targets at the Colossus data center—including hundreds of thousands of next-generation Nvidia GB200 and GB300 GPUs—is accelerating capital expenditures for its AI segment, escalating cash burn concerns among institutional investors.
- Starlink Mobile Monetization and Spectrum Disadvantages: Analyst commentary highlighted that Starlink's direct-to-cell network expansion following its 800MHz spectrum acquisition faces multi-year commercial delays and severe low-band spectrum depth deficits relative to incumbent wireless carriers like Verizon.
- Memory Hardware Bottlenecks and Supply Strain: Industry-wide DRAM supply constraints and rising server memory component costs threaten execution timelines for SpaceX's combined orbital hardware and ground-based AI compute deployments.
Find out more